A/B-test winners are often communicated like “12% uplift in sales (p<0.05), while the hypothesis that is being tested only tests if the variant would outperform control. Due to variance in both variant as control, you can only communicate the probability that the variant outperforms control. The observed uplift is just a coincidence and can only be communicated as a range.
Content
Some essential background information
As a refresher, the p-value (p<0.05) that is written behind the uplift can be interpreted as the chance that the observed difference between control and variant is a coincidence. So in the given example, this chance is smaller than 5%.
The calculator below learns us that, in this case, an observed conversion rate of 2,5% could as well have been any ratio between 2.35% and 2.66%. You can play with it to get a feeling of the confidence band range for different cases.
Calculate probability distribution for a binominal proportion
What could have been an observed conversion rate as well? Using the Clopper-Pearson Method
Input
Conversion Rate
The probability distribution
Your conversion rate varies from day to day. This is understandable; there is variation in almost everything that affects it; the weather, what is in the news, the amount on the bank account from your visitor, pricing or sale on competitor websites and many more influence your visitor already before they even landed on your website. When browsing, there are the facturs that you can work on that influence your visitors. Think of UX, loading speed, the website appearence on the visitors screen, your communication, etc.
All these factors ultimately combine to one conversion rate. This can be 4.0% today, 3.5% yesterday and 4.3% tomorrow. Now imagine that you only have the data from yesterday. In that case, you could think "so my conversion rate is 3.5%. I measured it". But we know that that is not correct; when you would have measured one day later, you would have saidyour conversion rate is 4.0%. "I measured it".
How do you know the spread in your data?
So, how can you know your real conversion rate? Theoretically, this is only possible with an infinite amount of data; this is something that even the biggest ecommerce players don't have. Therefore, in theory, there is always made an assumption. In the real world, with finite amounts of data, you should work with spread. There are several methods to calculate the spread, one of them is the Clopper Pearson method (from 1934). The outcome from this method is a range, given a certain probability.
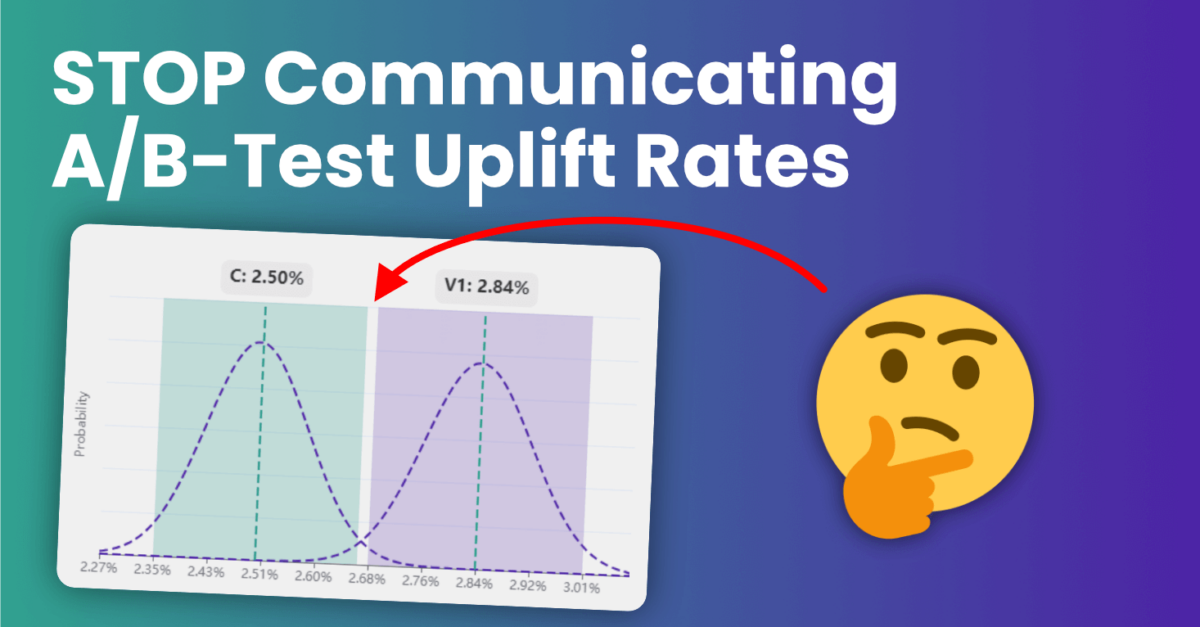
Spread in A/B-testing
In A/B-testing, you test one group, with its own spread, to another with its own spread. The observed conversion rates for both groups are just a random spot on their probability distribution. Since the uplift is the quotiënt of these rates, you can't just say "The uplift is x percent". What you can communicate is an expected uplift range. The below calculator does this math for you:
Calculate A/B-test Result
Frequentist calculator for A/B-tests. Includes the expected uplift range for a given probability.