Finding the biggest bottlenecks is the most challenging yet crucial aspect of Conversion Optimization. Everything that follows, such as formulating a hypothesis, conducting an A/B test, etc., can, of course, go wrong, but in comparison to identifying bottlenecks, it's a formality. After all, if the issues you are addressing do not touch upon the most significant problems, you can formulate your hypothesis correctly and conduct statistically sound tests, but you won't solve the real problem.
content
Proven Method for More Success with CRO - 10 Steps
Every company is unique, so relying solely on best practices won't cut it; you really need to understand and combine the strategy, proposition, positioning, and customer desires to get the most out of it. Insight into visitor behavior is a crucial element in this process.
Imagine having to repair a bicycle in pitch darkness. You haven't ridden it yet and can't try it out. Since you can't see anything, you have to test each mechanism individually. After a long process of testing, feeling around, and possibly injuring your fingers, you discover that the derailleur is not functioning properly. Then, after extensive testing and probing, you figure out that a new cable is needed. And now, try finding the right tool, let alone opening the derailleur adjuster...
Fear not, you are still reading about Conversion Optimization. And below, you'll learn how to turn on the light.

The method for gaining better insight into your bottlenecks
During the time I had a startup for an analytics tool for conversion optimization, we experimented extensively on how to set up ecommerce analytics more efficiently and effectively:
From this, a method emerged that, while very simple and remarkably effective, is hardly ever used around me. That's why I'm sharing it here. This method can also be applied in Google Analytics, saving a lot of time and providing valuable insights. I called it the Conversion Matrix back then, but feel free to name it differently.
I have already implemented this method for several clients, and it has been the key factor in many successful A/B tests.
Why you've never fully unleashed your potential - Top-down vs Bottom-up
In typical data investigations, ideas are often thrown around, and there's a bit of poking here and there. Someone suggests something that can be explored, and based on the data that Google Analytics collects by default, supplemented with some events and custom dimensions, a manual investigation is carried out. Apart from providing a very fragmented view of visitor behavior, it requires a lot of manual effort, and you have to wait and see if you happen to stumble upon the most significant bottlenecks.
For instance, to find out what percentage of visitors use the menu, you first need to create a segment for visitors who use the menu. Then you look up the total number of visitors to divide the first number by it. Now you know the percentage of total users who use the menu. If you then want to know how this percentage varies per device category, you have to repeat the same process for each device category. The same goes for logged-in visitors, visitors with a shopping cart, etc. And even then, you still don't know how important the menu-open ratio is compared to all the other potential ratios you could have looked into.
This is how you find the most important bottlenecks in CRO
You can see the problem: for each metric, you have to perform many manual actions. Of course, you can work with blended data in Looker Studio, but that only partially solves the problem.
The goal in CRO is to figure out where the biggest bottlenecks are and then solve them. The biggest bottleneck can be anywhere in the customer journey, and potentially there are at least dozens of metrics for which you can investigate the ratios. On all these metrics, you can delve into numerous dimensions, multiplying the potential number of identified bottlenecks into the thousands. That's why it's much better to approach your data analysis bottom-up.
The Conversion Matrix
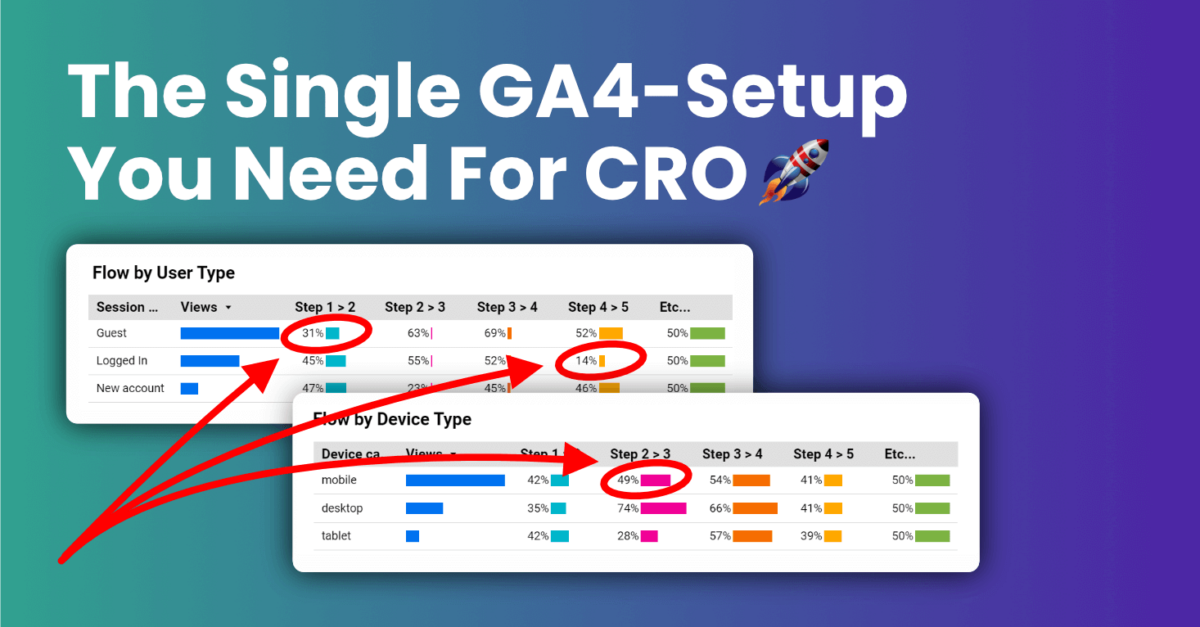
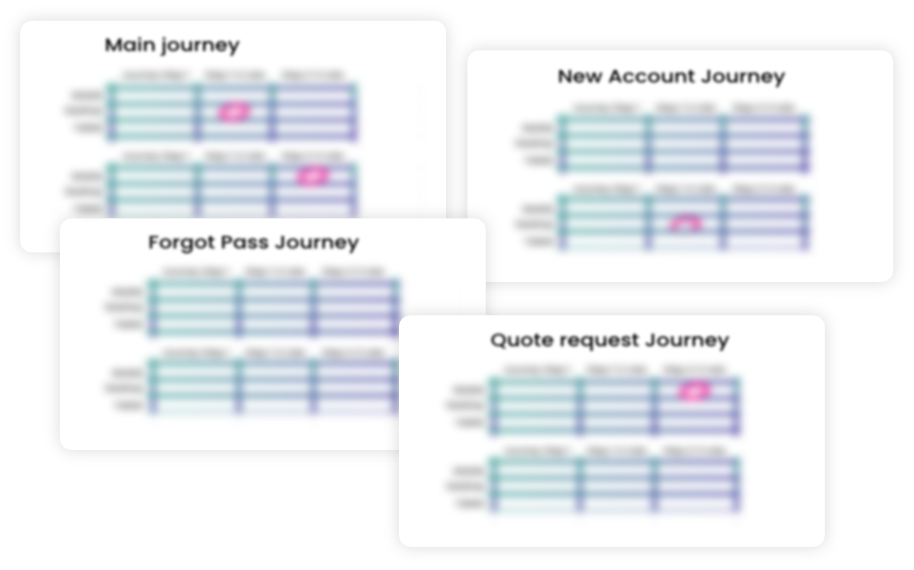
Think back to the example of the bicycle at the beginning: The Conversion Matrix turns on the light and, at a glance, shows you where the pain points are:
The Conversion Matrix is perfect for conversion optimization because it provides an overview of the playing field of your entire website. On the horizontal axis, you find the customer journey(s), and on the vertical axis, the dimensions are listed. You can have multiple sub-journeys, such as creating an account or logging in or returning, and the main journey is the one that earns you your bread, so if you have an online shop: from the visit to placing an order.
The metrics and dimensions in the Conversion Matrix should precisely cover your specific situation, so think carefully about this. If, for example, visiting a discount code page is crucial to the customer experience in your case, create a custom dimension like "visited-discount-code-page."
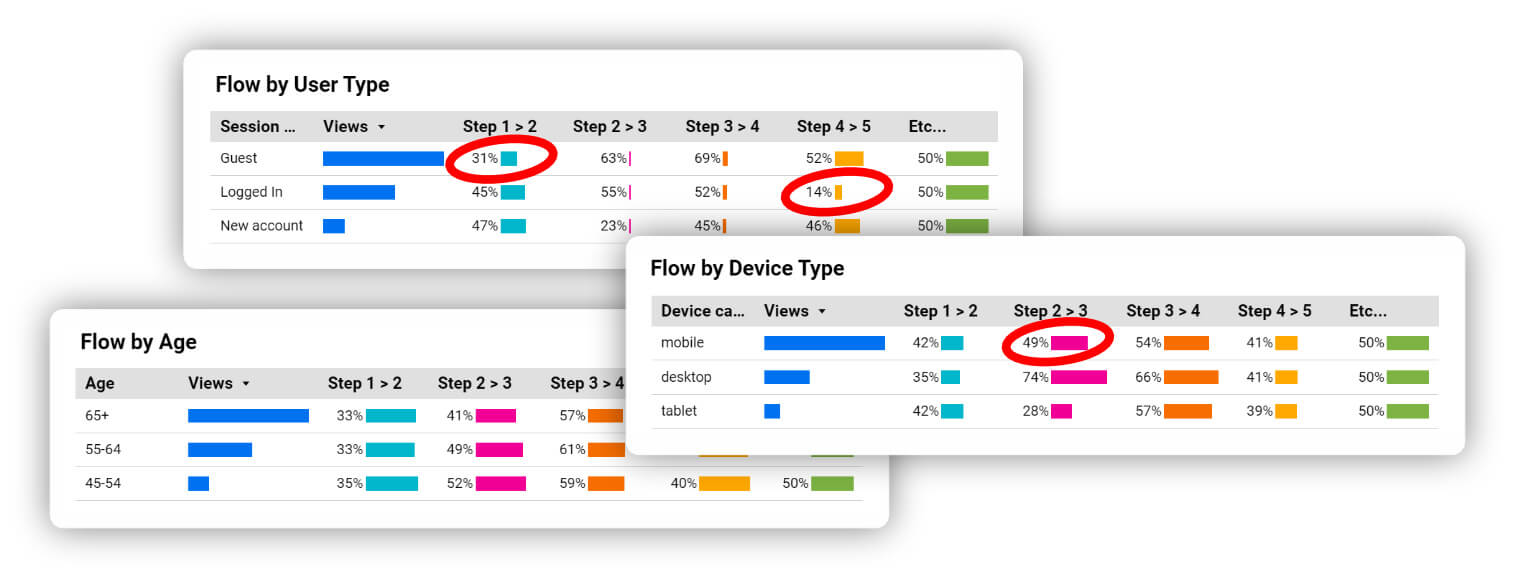
Afterward, when necessary, you can delve deeper into bottlenecks to get a clearer understanding of where the problem lies. Because all values are custom metrics and dimensions, you can now easily drag them in and out of your widgets in Looker Studio, without the need for manual calculations. (By the way: if you're not using Looker Studio yet, start using it! It works so much more efficiently than searching for data in Google Analytics.)
In the above animation, it is discovered that the flow ratio from step 2 to step 3 of the Customer Journey is underperforming for Samsung smartphones with the Chrome browser. Now you can use this insight in user research to find out why things are going wrong there. The given example is more technically oriented, and by dragging in "softer" dimensions like landing page type or custom customer-related dimensions, you discover entirely different perspectives.
In summary, the Conversion Matrix ensures that the bottlenecks come to the surface instead of having to manually analyze all potential combinations of customer journey steps and dimensions. This saves an incredible amount of work and often makes the difference in practice between finding or not finding the most crucial bottlenecks.
Measure important steps in the Customer Journey as a custom metric instead of using an event.
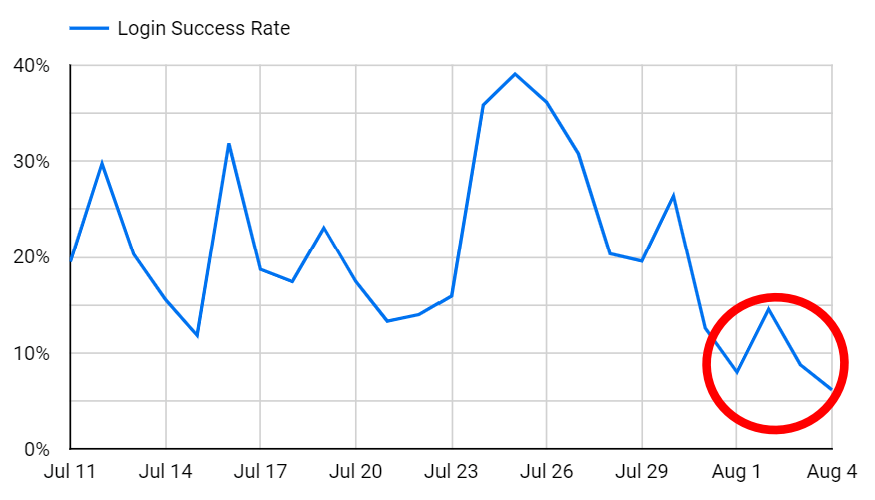
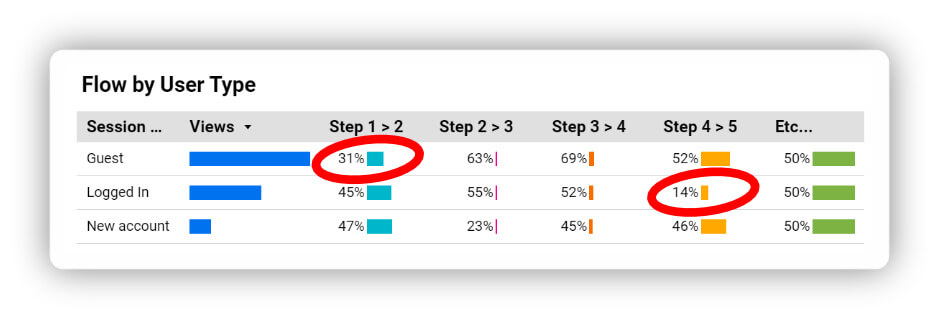
The use of custom metrics has many advantages. In addition to easily dragging them into a report without having to create a segment everywhere, you can also easily create a (line) graph that shows the development over time. This way, you can quickly spot any drops and take action where needed. But the biggest advantage of custom metrics is that you can display values as a percentage of flow from the previous step in the customer journey. Instead of an absolute number, you see the relative flow, making the performance of that step directly interpretable and comparable. "50% flow" gives you a much better idea of the performance than "120,000 people"; for salespeople, absolute numbers are often more interesting, but for conversion optimization, flow percentages are much more informative.
Just for completeness: widgets in Looker Studio consist of two elements for data, metrics, and dimensions. Whether they already exist as standard or are custom-added doesn't matter for use. However, you should consider the scope of dimensions; for the Conversion Matrix, you need user scope.
A request to a developer for measuring a specific action on the website often results in an event. This can be useful for occasional research, and of course, you can filter in Looker Studio based on events, but this only provides absolute numbers, and you cannot create calculated metrics for them. For the Conversion Matrix, this is not an option.
How to Set Up the Conversion Matrix - Step-by-Step Guide
- Determine the customer journey(s)Apply this very specifically to the situation and do it refined; don't skip any steps. For example, on a login page, selecting the username field can be a step, typing the username, selecting the password field, etc., up to clicking the login button.
- Determine customer-specific custom dimensions.Is there a distinction between B2B and B2C customers? Is the assortment divided into different customer segments?
- Create the custom metrics in Google Analytics.For each step in the customer journey, create one custom metric with the name journey-[subjourney]-[step]. For the first example step in the script, it would be: journey-main-visit.

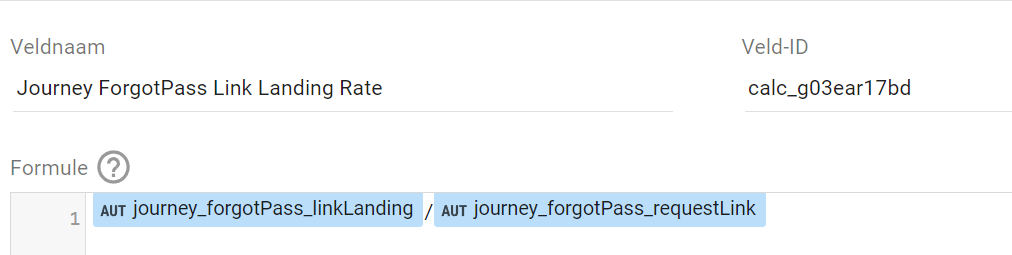
- Create the calculated metrics in Google AnalyticsFor each step in the customer journey, create one calculated metric with the name journey-[step]-rate. The outcome of this calculation is the flow ratio from the previous step to the mentioned step.
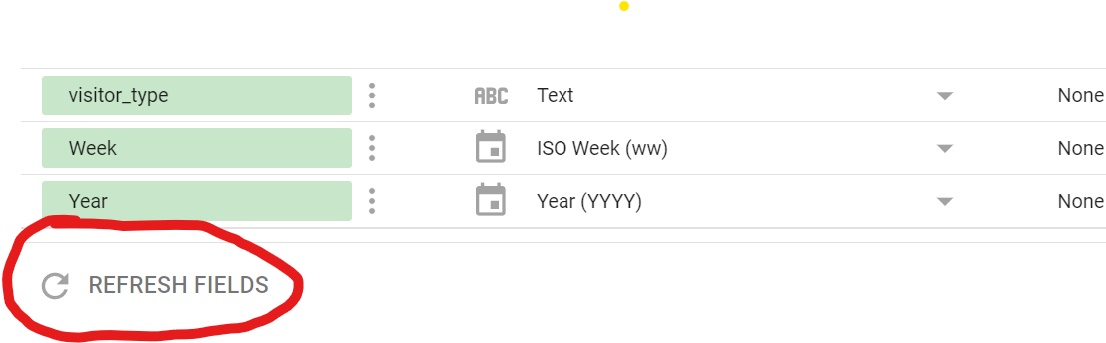
- Create the custom dimensions in Google Analytics.Based on the dimensions you determined in step 2. Make sure to use user-scope.
- Complete the measurement script for each step in the customer journey.For each step, a different approach may be needed to detect it with JavaScript. You can find some examples in the measurement script template below.
- Run the measurement script through Tag Manager.Also, add a variable "journeyStep" here, and a trigger that listens for the dataLayer event "journeyStep." Configure a tag that, based on this, sends the journey steps as events to Google Analytics.
- Update the connection with Google Analytics in Tag Manager in Looker Studio.To import the new metrics and dimensions.
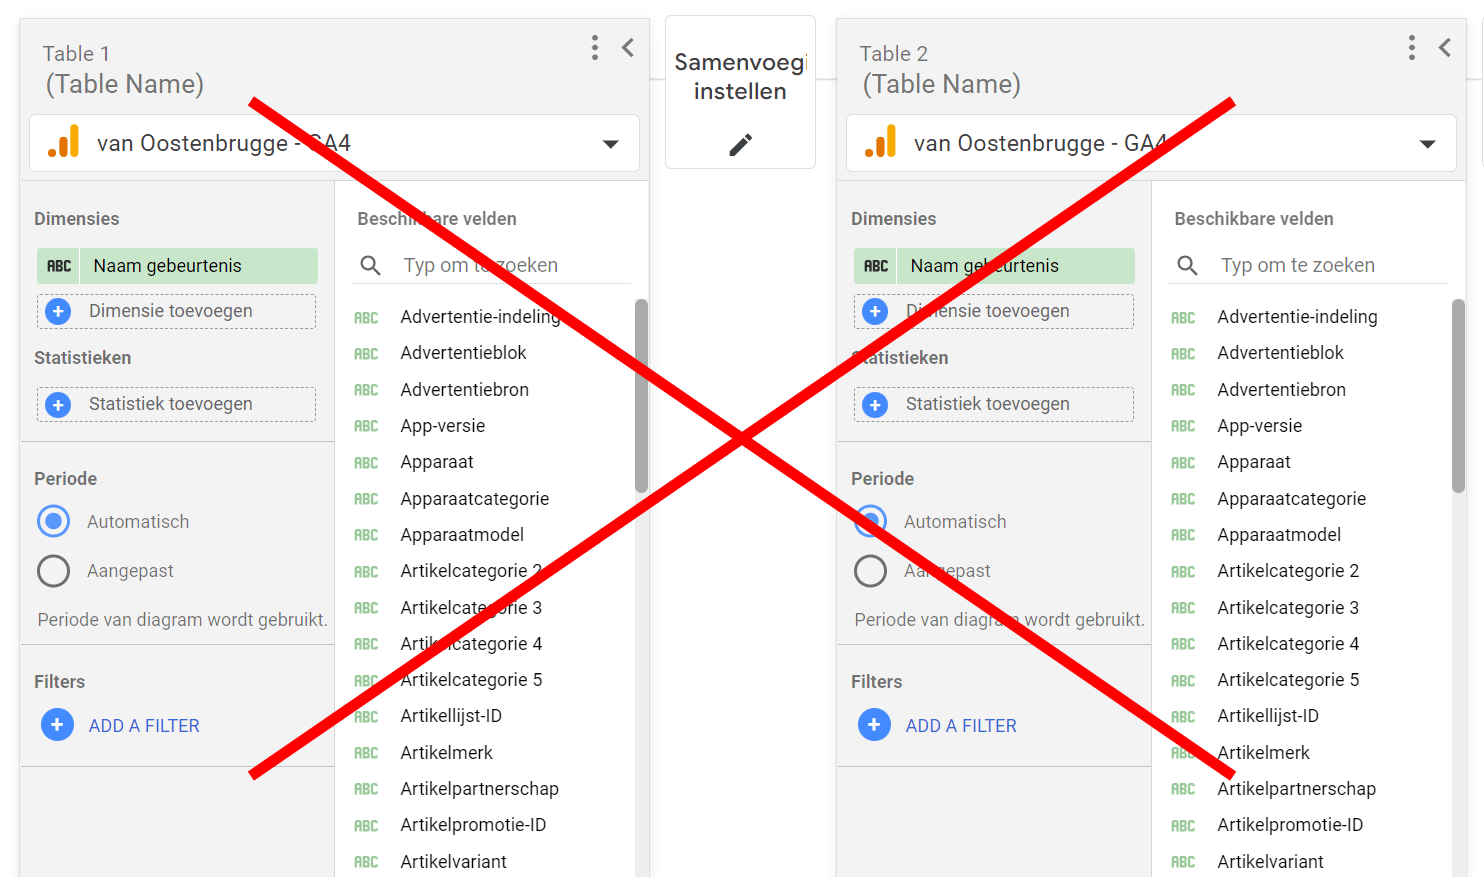
- Create the dashboards in Looker Studio.List the metrics, copy the table, and set a different dimension in each table. At the top, place a table without a dimension for an overview.
- Revel in all the insights you gain

The Javascript
You can copy and customize the script below for your specific situation. It has evolved step by step based on my experiences with clients and mainly does the following:
- A hierarchical definition of the steps in the customer journey (here called touchpoints) and a function that returns whether the step has been reached. The step can be achieved directly at page load or later, for example, on a button click.
- A check if a journeystage is already saved in localStorage. If that's the case, the script works from this status; otherwise, all steps are set to "untouched."
- If a step in a journey is reached, and the status of the step is still untouched, an event is sent to the dataLayer, and the current journey state is updated in localStorage.
- All previous steps in a journey that have not been reached yet are also included. It's common on a website that a measurement might fail at times, and this way, the script creates the purest possible picture to later calculate the flow per step as accurately as possible.
(function () {
    // Define touchpoints. Top levels are journeys, with children as steps in that journey. The steps and functions are examples and should be tailored to the specific website.
    var touchPoints = {
    main: {
                domain: 'https://www.domain.nl',
                steps: {
                    visit: {
                            checker: function () {
                                    return true
                            },
                            stepId: 1
                        },
                    login_message: {
                            checker: function () {
                                    return  google_tag_manager['GTM-12345678'].dataLayer.get('loginMessage')
                            } == 'login_message'
                        },
                        stepId: 2
                    },
                    checkout_step_1: {
                        checker: function() {
                            return location.pathname == '/checkout/step1' && productCategory == 'online'
                        },
                        stepId: 3
                    },
                    checkout_step_2: {
                        checker: function() {
                            return location.pathname == '/checkout/step2' && productCategory == 'online'
                        },
                        stepId: 4
                },
            },
    login: {
        domain: 'https://login.domain.com',
                steps: {
                login_page: {
                    checker: function() {
                            return location.pathname == '/login'
                    },
                    stepId: 1
                },
                types_mail_address: {
                    checker: function() {
                            var mailField = document.querySelector('input#username');
                            if (mailField && mailField.checkValidity()) {
                                updateTouchPoint('login', 'types_mail_address');
                            } else if (mailField && virtualPagePath == '/login') {
                                mailField.addEventListener('input', function () {
                                        updateTouchPoint('login', 'types_mail_address')
                                }, {
                                        once: true
                                });
                            }
                    },
                    stepId: 2
                },
                mail_recognized: {
                    checker: function() {
                            return document.querySelector('input#password') && virtualPagePath == '/login'
                    },
                    stepId: 3
                },
                types_password: {
                    checker: function() {
                            var passField = document.querySelector('input#password');
                            if (passField && virtualPagePath == '/login') {
                                passField.addEventListener('input', function () {
                                        updateTouchPoint('login', 'types_password')
                                }, {
                                        once: true
                                });
                            }
                    },
                    stepId: 4
                },
                login_complete: {
                checker: function() {return location.pathname == '/login-success'},
                stepId: 5
            }
        }
    }
};

    // Only continue if dataLayer exists and localStorage is supported
    if (dataLayer && localStorageSupported()) {

        // Update version to overwrite older local storage files when the touchPoints variable has been updated
        var version = 1;

        // Customer specific variables
        var virtualPagePath = google_tag_manager['GTM-12345678'].dataLayer.get('virtualPagePath');
        var domain = document.location.origin;

        // Get current journey stage if availble in local storage
        try {
            if (localStorage.getItem('track_journeyStage-' + version)) {
                    var journeyStage = JSON.parse(window.localStorage.getItem('track_journeyStage-' + version));
                    for (var i = 0; i < journeyStage.length; i++) {
                        touchPoints[journeyStage[i].sub].steps[journeyStage[i].key].status = true;
                    }
            } else {
                    // No saved journey info yet -> initiate a ne journey
                    updateLocalStorage();
            }
        } catch (error) {
            updateLocalStorage();
            // Send error event to GA here...
        }
        // Check all touchpoints on landing
        for (var subFunnel in touchPoints) {
            if (touchPoints.hasOwnProperty(subFunnel)) {
                    for (var key in touchPoints[subFunnel].steps) {
                        if (touchPoints[subFunnel].steps.hasOwnProperty(key) && touchPoints[subFunnel].steps[key].status == undefined && touchPoints[subFunnel].domain == domain) {
                                if (touchPoints[subFunnel].steps[key].checker()) {
                                    // Touchpoint touched, update status
                                    updateTouchPoint(subFunnel, key);
                                };
                        }
                    }
            }
        }
    }
    // Functions
    function updateTouchPoint(subFunnel, key) {
        // Update touchpoint
        touchPoints[subFunnel].steps[key].status = true;
        sendMetric(subFunnel, key);
        // And set all earlier steps in the subfunnel to true
        for (var checkKey in touchPoints[subFunnel].steps) {
                if (touchPoints[subFunnel].steps.hasOwnProperty(checkKey)) {
                    var lowerStepId = touchPoints[subFunnel].steps[key].stepId > touchPoints[subFunnel].steps[checkKey].stepId;
                    if (touchPoints[subFunnel].steps.hasOwnProperty(checkKey) && touchPoints[subFunnel].steps[checkKey].status == undefined && lowerStepId) { // break
                            touchPoints[subFunnel].steps[checkKey].status = true;
                            sendMetric(subFunnel, checkKey);
                    }
                }
        }
        updateLocalStorage();
    }
    function updateLocalStorage() {
        var sendableArray = [];
        for (var subFunnel in touchPoints) {
                if (touchPoints.hasOwnProperty(subFunnel)) {
                    for (var key in touchPoints[subFunnel].steps) {
                            if (touchPoints[subFunnel].steps.hasOwnProperty(key) && touchPoints[subFunnel].steps[key].status) {
                                var sendableObject = {};
                                sendableObject.key = key;
                                sendableObject.sub = subFunnel;
                                sendableArray.push(sendableObject);
                            }
                    }
                }
        }
        window.localStorage.setItem('track_journeyStage-' + version, JSON.stringify(sendableArray));
    }

    function sendMetric(subFunnel, metric) {
        var stepName = 'journey_' + subFunnel + '_' + metric;
        dataLayer.push({
                event: 'journeyStep',
                journeyStep: stepName
        });
    }

    function localStorageSupported() {
        var support = false;
        try {
                var rand = Math.random();
                support = typeof window.localStorage !== "undefined" &&
                    (localStorage.test_support = rand),
                    (localStorage.test_support === rand);
                localStorage.removeItem("test_support");
        } catch (e) {
                support = false;
        }
        if (support) {
                return true;
        }
    };
}) ();
Things to consider:
- The tracking is done on a user basis; it looks across all sessions per user to see if they have reached certain journey steps. This makes this method particularly suitable for onboarding new customers and less suitable for optimizing on existing, returning customers who have already gone through the flow once. If you want to optimize conversion for returning customers, you could do everything on a session basis; use sessionStorage instead of localStorage and work with sessions in Google Analytics instead of users.
- The data collected is not perfect; for example, it can happen that someone goes through the initial steps of a journey on their phone and then completes the entire journey on their laptop. This doesn't matter; the key is to find noticeable outliers in the flow per dimension value in journey steps, and for that, a general picture is sufficient.
Wishing you much success and enjoyment in optimizing your website!